GEEKING OUT
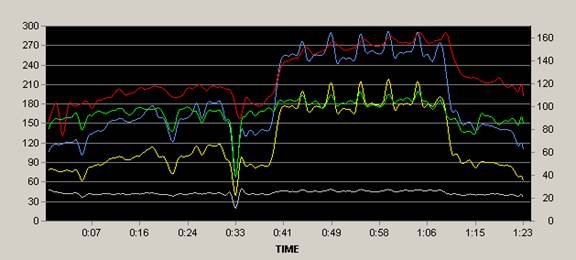
A few people wanted me to post some PowerTap data, so here is a typical output from the PowerTap. This was a 90 minute workout, with 30 minutes of “Light” and an all out “Surge” every 5 minutes during that period of light. When doing the surge, you can only shift down one gear, so it is all about the cadence. My max. cadence was 163.
Do the data is as follows:
Red is Heart Rate
Green is Cadence
Blue is Speed (x10)
Yellow is Power
Scale on the right is for cadence and HR, left hand side is power and speed (x10)
Have fun geeks.
posted by M_A_T_T @ 7:31 AM
![]()

0 Comments:
Post a Comment
<< Home